DIRECTORY / data-science
Data Science_
Notes from the workbench. Pick a file and dive in.
Esc
9 entries│subscribe --rss ↗
00data-science/collaborative-filtering-and-matrix-factorization.md5.4 KiB
Collaborative Filtering and Matrix Factorization
$ head -n 12 collaborative-filtering-and-matrix-factorization.md
For many online services (including E-commerce, online news and social media applications), the secret of recommendation system is in modelling users' preference on items based on their past interactions (such as: ratings, clicks, purchases, likes, ...). It is as known as [Collaborative Filtering](https://en.wikipedia.org/wiki/Collaborative_filtering). ## Interaction Matrix. The matrix shown below is a sample of user-item matrix (or called interaction matrix). 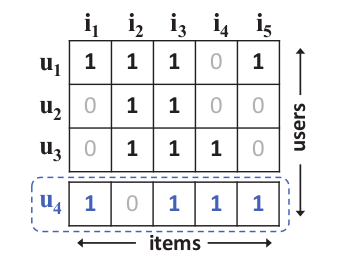 Let's say we have $M$ users and $N$ items (products). $Y \in \mathbb{R}^{M \times N}$ is an interaction matrix from users' implicit data where, $$y_{u, i} =01data-science/density-based-spatial-clustering-of-applications-with-noise.md2.8 KiB
DBSCAN Algorithm
$ head -n 12 density-based-spatial-clustering-of-applications-with-noise.md
[Density-based spatial clustering of applications with noise (DBSCAN)](https://en.wikipedia.org/wiki/DBSCAN)is a clustering algorithm. ## Key Concepts Let's say $X$ is the sef of all data points, $dist(x, y) \in R$ is a functionto measure the distance between any two data points, $\epsilon \in R^+$ is thedistance limitation and $minPts \in Z^+$ is the density limitation. * Given $\epsilon \in R^+$ and $p \in X$, the **$\epsilon$ neighbors** of $p$ is $N_{\epsilon}(x) = \{ y \in X \mid dist(x, y) \leq \epsilon \}$. * Given $x \in X$, the **density** of $x$ is $\rho(x) = \lvert N_{\epsilon}(x) \rvert $.02data-science/k-means-clustering.md1.6 KiB
K-Means Clustering
$ head -n 12 k-means-clustering.md
[K-Means](https://en.wikipedia.org/wiki/K-means_clustering) is a clustering algorithm by which you can cluster data points into specific number of groups. Given data points $X = \{x_1, x_2, \cdots, x_n \}$ where $x_i \in R^m$,we want to calculate a clustering $\{S_1, S_2, \cdots, S_k\}$ where, * $\bigcap_{i = 1}^n S_i = \empty$ and $\bigcup_{i = 1}^n S_i = X$.* WCSS (within-cluster sum of squares) $\sum_{i = 1}^k \sum_{x \in S_i}{\lvert \lvert x - u_i \rvert \rvert}^2$ is minimum, where $u_i = \frac{1}{\lvert S_i \rvert} \sum_{x \in S_i} x$ is the center of the cluster $S_i$. ## Pseudo Code 03data-science/association-rule-mining-and-apriori-algorithm.md6.9 KiB
Association Analysis and Apriori Algorithm
$ head -n 12 association-rule-mining-and-apriori-algorithm.md
Association analysis is one of the common parts of unsupervised machine learning.In association analysis, our goal is briefly to find things happening together. Look at this table of people puchasing items: | ID | Items ||---:|:----------:|| 1 | Milk, Bread || 2 | Butter || 3 | Beer, Tissue || 4 | Milk, Bread, Butter || 5 | Bread |04data-science/multi-layer-perceptron.md3.9 KiB
Multi-Layer Perceptron and Back-Propagation Algorithm
$ head -n 12 multi-layer-perceptron.md
## Perceptron In machine learning, perceptron is a binary classifier, which calculates alinear combination and outputs `1` or `-1`. ```dotdigraph { rankdir=LR x0 -> y [label = "w0"] x1 -> y [label = "w[1]"]05data-science/adaptive-boosting-algorithm.md2.7 KiB
Adaptive Boosting Algorithm
$ head -n 12 adaptive-boosting-algorithm.md
[Adaptive Boosting (AdaBoost)](https://en.wikipedia.org/wiki/AdaBoost) is anensembled machine learning algorithm. The key idea is: * Improving the weights of mis-classified instances. * Voting by a sort of weak classifiers can lead to a strong classifier. * Better weak classifiers should have greater weights to vote. AdaBoost is sensitive to noisy data and outliers. ### Input * Train instances: $T = \{ (x_1, y_1), (x_2, y_2),\cdots,(x_N, y_N) \}$,06data-science/entropy-and-information-gain.md9.0 KiB
Entropy and Information Gain
$ head -n 12 entropy-and-information-gain.md
## 1. Play golf or not? To begin with this topic, let's think about a question from the dataset given below. | Outlook | Temperature | Humidity | Windy | Play Golf ||:--------:|:-----------:|:--------:|:-----:|:---------:|| sunny | warm | low | no | **yes** || sunny | hot | medium | no | no || rainy | warm | low | yes | no || overcast | hot | high | no | no || sunny | warm | medium | yes | **yes** || rainy | hot | medium | yes | no |07data-science/graph-data-model.md6.4 KiB
Graph Data Model
$ head -n 12 graph-data-model.md
## 1. Graph Data Models ### 1.1 PGM - Property Graph Model Property graph model is a kind of formal definition of graph data. In thismodel, data is reprensented as a directed, attributed multi-graph. Let's say: * $\mathcal{O}$ is a set of objects.* $\mathcal{K}$ is a set of property keys.* $\mathcal{L}$ is a set of labels.08data-science/mathjax-introduction.md8.0 KiB
Mathjax Quick Reference
$ head -n 12 mathjax-introduction.md
[MathJax](https://www.mathjax.org/) is a javascript display engine which can beeasily integrated into web pages. In this article, I want to cover many commonusage of MathJax. ## 1. Basic Grammar There are two ways to insert a MathJax expression: * Insert a inline expression. * Insert a block expression. | mode | command | example | preview |No matches. Try a shorter filename.
end of directory listing. ▉